

Reports
Exportable summaries of what shipped, what inventory is worth, and which orders are stuck on backorder — across every client.
The Reports section turns warehouse activity into summaries you can read on screen or export to CSV. There are six — Shipments, Shipped Items, Sales by SKU, Kits, Inventory Value, and Backorders — and all six are open to client users as well (a client sees only their own brand's rows). By default each spans all your clients; pin a brand in the topbar client switcher to narrow it (there's no per-report client filter — scope comes from the switcher, and the footer reads "Scoped to X" when one is pinned). Shipments, Inventory Value, and Backorders carry a per-row Client column; Shipped Items and Kits don't, so pin a brand when you need to know whose row is whose.
Where it is switched on, the group holds one more entry, Cost to Serve. It shows what each brand cost you in labour. It is for warehouse staff only, and it has its own page: Cost to serve.
Export writes the current page — except on Backorders and Sales by SKU
On Shipments, Shipped Items, Kits, and Inventory Value the Export button downloads just the rows currently on screen, in the columns you have visible — the toast says "(current page)". To export everything, raise the per-page selector to 500 (its max) and export page by page. Backorders is one exception: its export is the whole filtered set, every column, with each SKU's blocked orders and open POs flattened in as extra rows (see Backorders). Sales by SKU is the other: its Export CSV button writes every column for every SKU matching your filters, capped at 10,000 SKUs per file. Every CSV is UTF-8.
Looking for Inventory Changes?
The stock-movement report now lives at Inventory → Adjustment Log, with the same search, filters, and export. Old links to it redirect there.
Shipments Report
Every shipment over a period, one row per shipment, with six headline tiles above the table: Total shipments, Total items shipped, Distinct items shipped, Customer cost (what shoppers were charged for shipping), Shipping cost (what the labels cost), and Shipment profit (the difference). The tiles follow the filters below them. A shipment whose order settles in a different currency than its label can't join the subtraction; the profit tile then notes "N shipments excluded from profit (currency mismatch)".
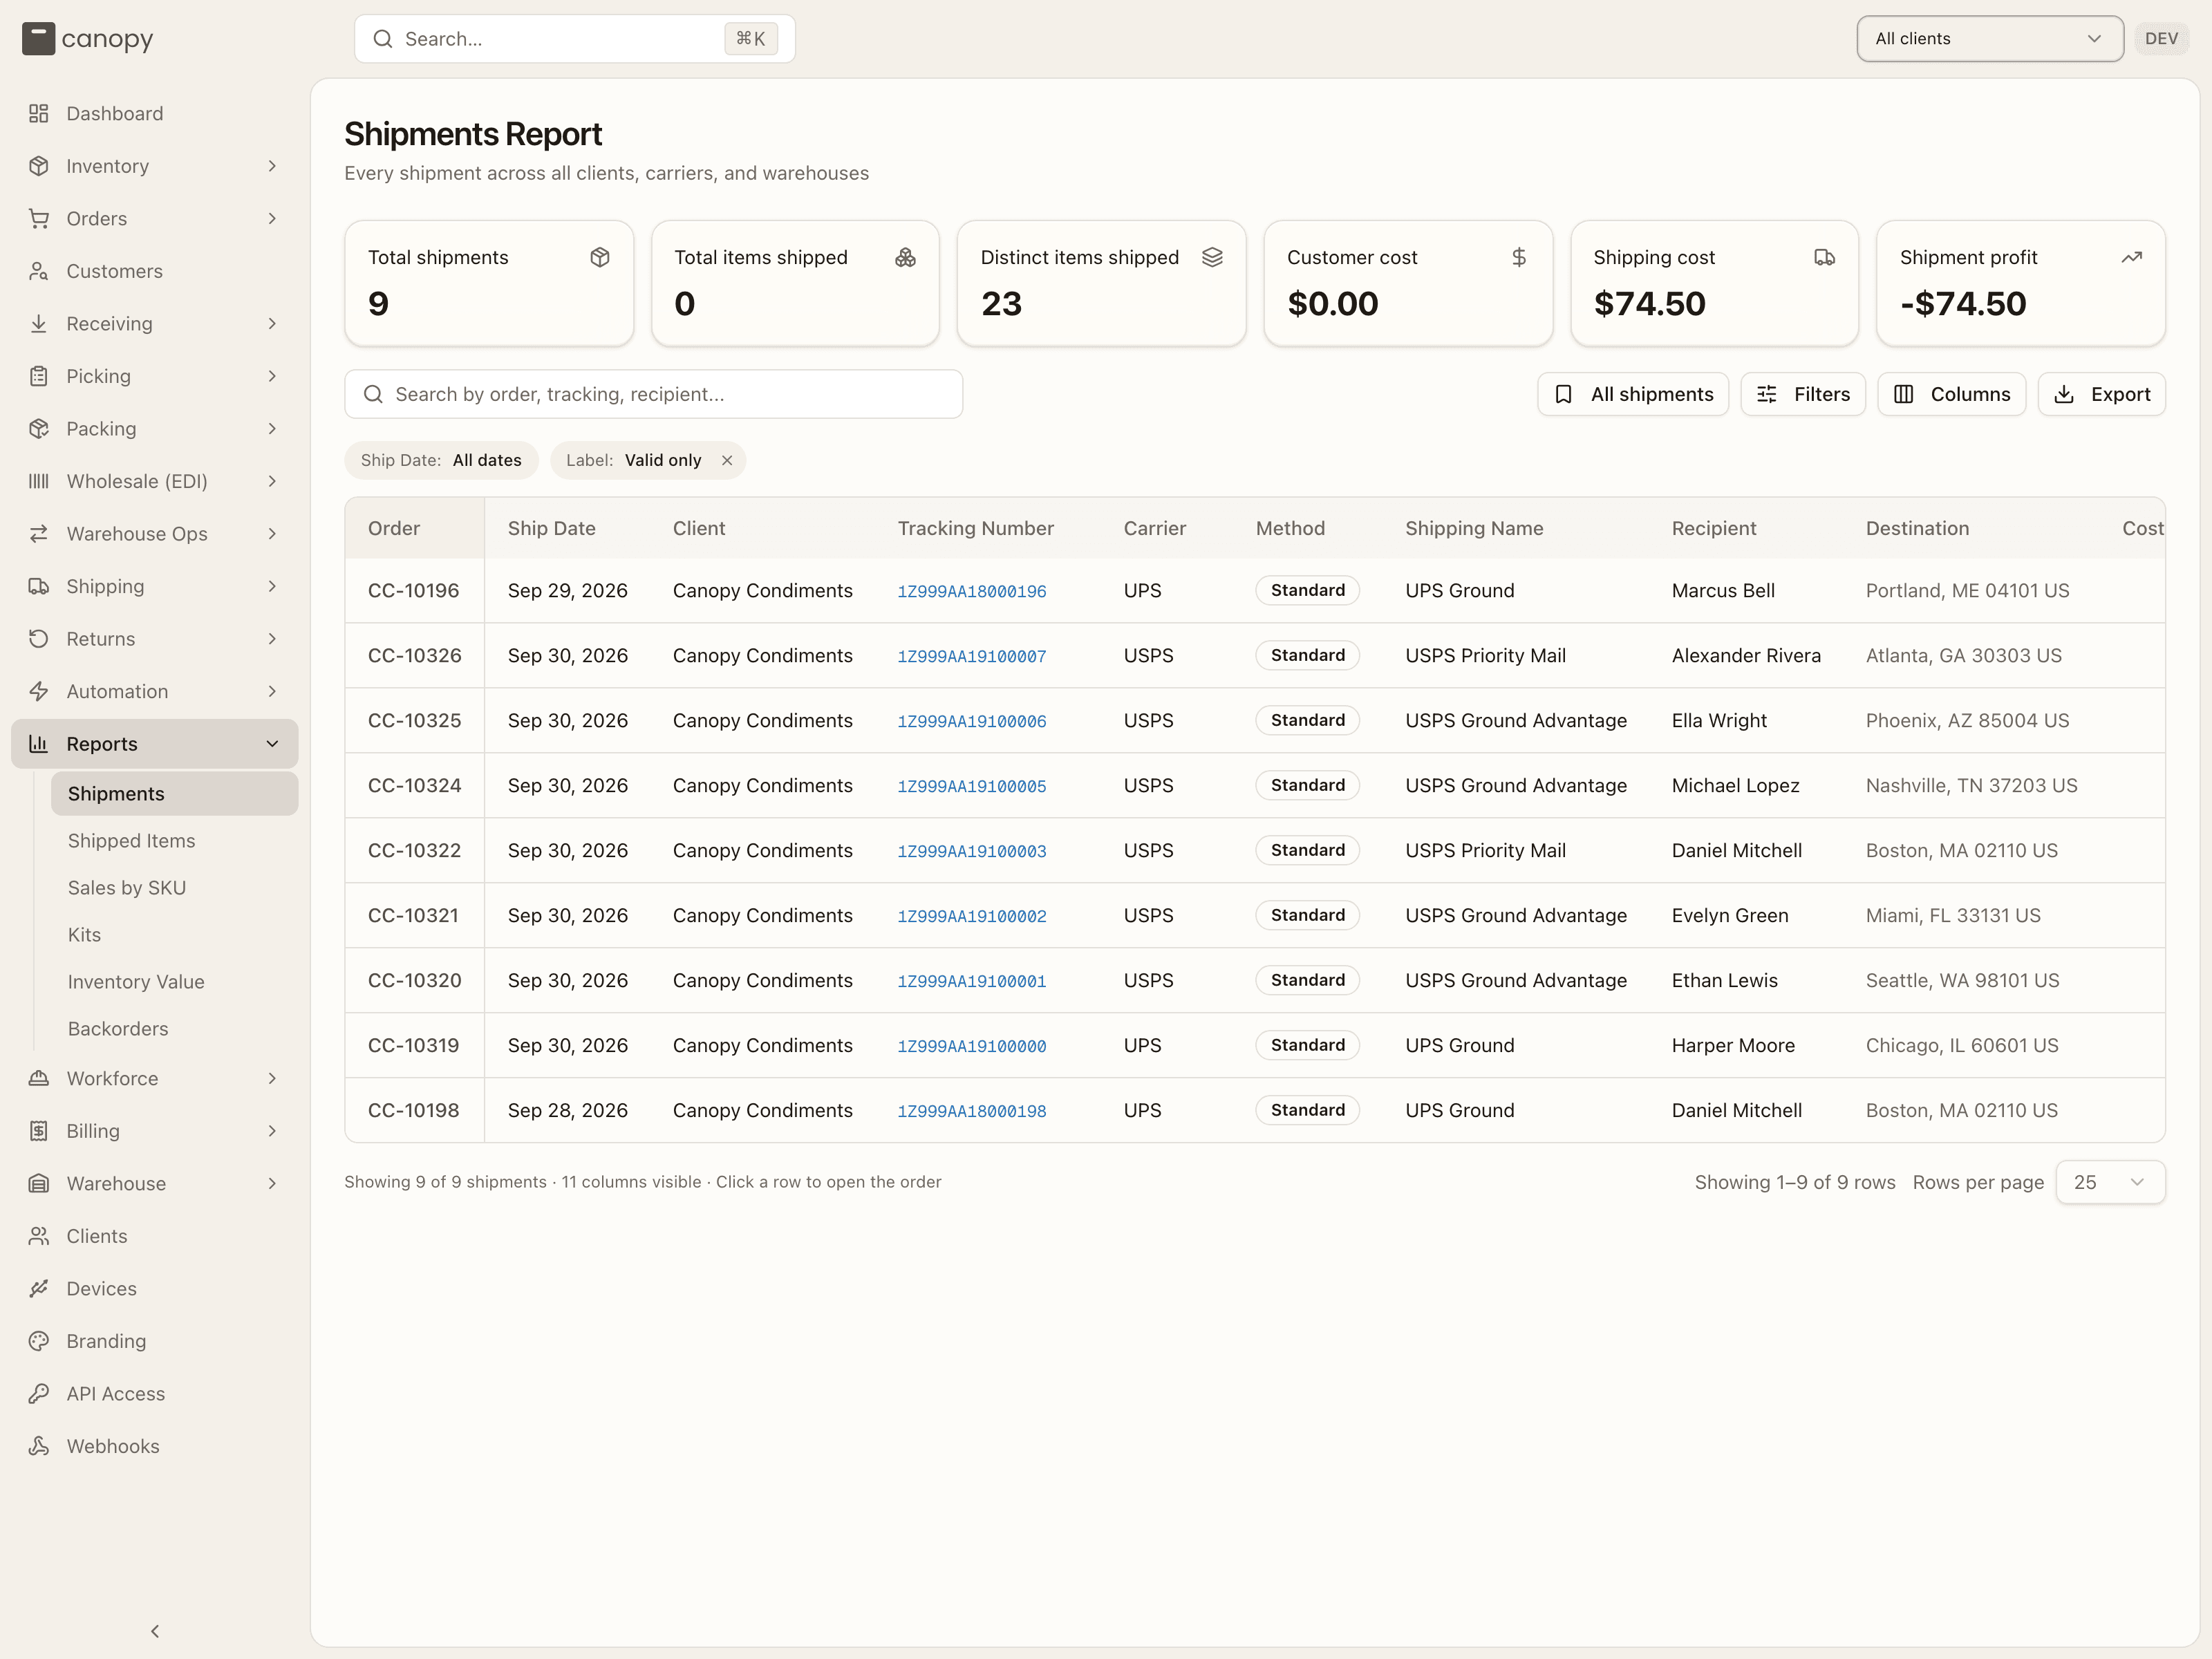
Filtering. The search box matches order number, tracking number, or recipient. The Filters popover has a Ship Date range, a Carrier picker, a Method picker (the order's shipping method — Standard, Express, and so on), and a Show voided labels checkbox. Voided labels are hidden by default — that's the "Label: Valid only" chip; remove the chip (or tick the box) to include them. Active filters show as chips, with Clear all to reset.
Views. The bookmark button beside the search box (it reads "All shipments" until you change something) holds four built-in presets — All shipments, Daily Ops (today's shipments), Billing Reconciliation (the cost columns, voided labels included), and Customer Support Lookup (recipient and tracking columns) — plus Save current view, which stores your own filter + column combination in this browser. Once your filters no longer match any named view the button reads "Custom view".
Columns. Order is always pinned to the left, and the essentials (Ship Date, Client, Tracking Number, Carrier, Method, Shipping Name, Recipient, Destination, Cost to Customer, Label Cost) can't be hidden. The Columns popover toggles the extras — Order Date, Packer, Warehouse, Alternate Tracking ID (x), Profile (x), Merged (x), Shipped using Canopy (a Canopy badge when the label cost sits with you, Client when the brand brought its own carrier account), Weight (lb), Size (in), Shipping Box, Line Item Total, Insurance, Promotion Discount, Discounted Line Items Total, Distinct Items, Quantity Shipped, Dropshipments (x), Lot Code, Lot Expiration — and pins any of them to the left alongside Order. Tracking numbers are links to the carrier's tracking page. Click any row to open the order behind it.
Shipped Items
The same shipping activity broken out per shipped line item — one row per line on each shipment, not one aggregate row per SKU, so a SKU split across pack records or partial shipments produces multiple rows. Use it to see real movers and reconcile outbound volume by product.
Six tiles sit up top — Total quantity, Distinct SKUs, Distinct orders, Avg units per order, Shipped subtotal, and Shipping % of revenue. The search box matches SKU, product, order, recipient, or tracking; the Filters popover mirrors Shipments — a Shipped Date range, Carrier, Method, and Show voided labels (off by default, the "Label: Valid only" chip).
The essential columns (Order, SKU, Product Name, QTY Ordered, QTY Shipped, Price, Shipped Subtotal, Created Date, Order Date, Bin Location, Warehouse) are locked on. Bin Location is the bin the unit was picked from and is not shown to client users — everything else here is. Extras you can switch on: Store, Packer, Profile (x), Tracking Number (a carrier link), View Label (opens the shipment's label in a new tab), Carrier, Method, the recipient's Email / Name / Address / Address 2 / City / Zip / State / Country / Company / Phone, Label Cost, Insurance (x), Dropshipment (x), Product Tariff, Product Tags (x), and Order Tags. Click a row to open the order.
The demo seed's historical orders carry no per-line shipment rows, so this report reads "No shipped items yet." there. On a live tenant it fills as soon as a pack completes.
Sales by SKU
Sales by SKU → /reports/sales-by-sku. One row per SKU, pairing what it
sold over a window against what's on the shelf — sell-through, rolling sales
totals, and how long the stock will last. Open to every role; a client sees only
their own SKUs.
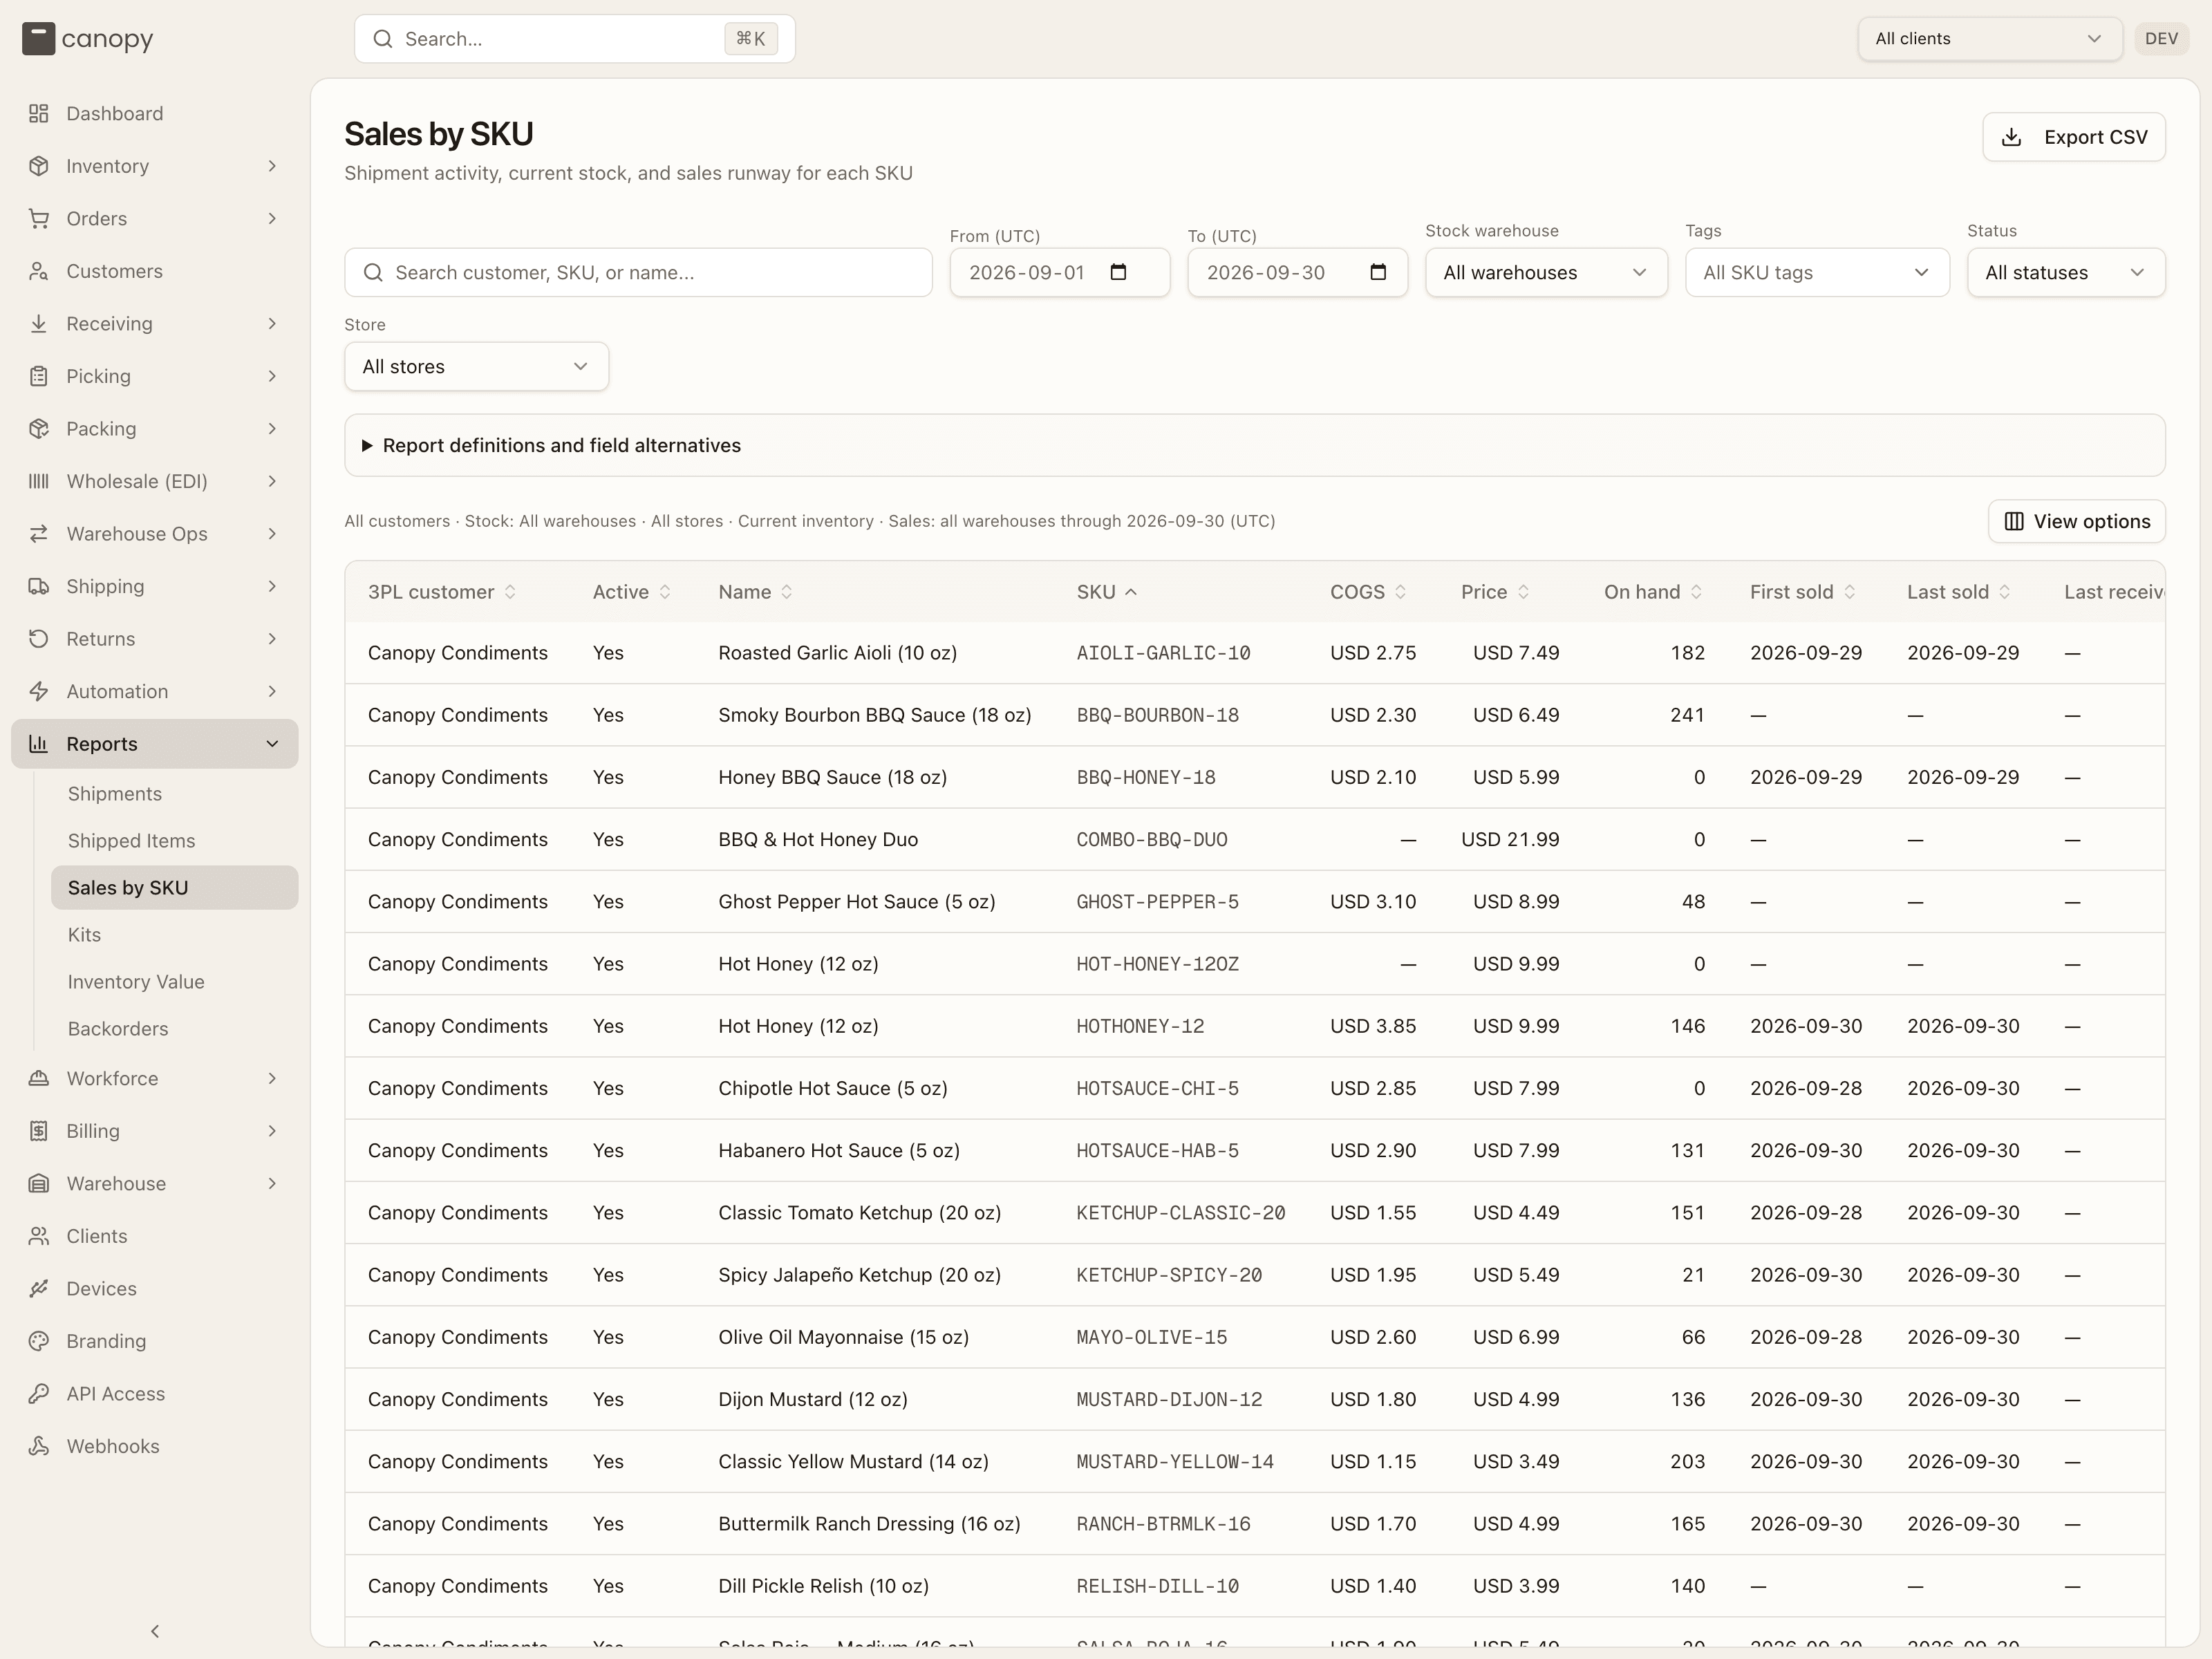
The filter row. A search box ("Search customer, SKU, or name…"), a From (UTC) / To (UTC) date pair defaulting to the last 30 days ending today, and four selects: Stock warehouse (All warehouses), SKU tags (All SKU tags, matching any tag you pick), SKU status (All statuses — the SKU's Active/Inactive state) and Store (All stores — a sales channel).
The scoping is the part worth knowing: sales always span every warehouse, while the Stock warehouse select narrows stock, receipts, counts, backorders and inbound supply. Picking a Store limits sales and backorders to that channel, but stock, allocations, receipts, counts and inbound stay shared.
The columns. Twenty-six of them — identity (3PL customer, Active, Name, SKU), money (COGS, Price, Current value), stock (On hand, Available, Backorder, On order), history (First sold, Last sold, Last received, Last qty received, Last stock take, Stock take adjustment), rolling sales (7-, 30-, 60-, 90-, 365-days sales plus Sales sent in period) and the projections (30 day sales thru %, Weeks until sold out, Months until sold out).
COGS is the per-unit Cost of goods from the SKU's Details tab, and Current value is Available × COGS — both stay blank when no cost is set. Available is sellable stock minus live allocations, per warehouse: any active, sellable bin outside a quarantine zone — including non-pickable reserve and overstock locations — on stock with no lot or an active lot inside the SKU's shelf-life window. Overstock waiting on a replenishment move counts here. Each rolling window ends on the selected To date.
Read the definitions before quoting a number
A Report definitions and field alternatives disclosure sits above the table and spells out exactly what counts: sales are units on active outbound shipment records dated by ship date, with voided, returned and externally fulfilled shipments excluded; a fulfilled wholesale order counts once, dated by its first carton label or freight booking; complete kits count once under the kit SKU and bundled components are excluded. It also defines the projections — 30 day sales thru % is 30-day units ÷ (30-day units + on hand) × 100, and Months until sold out is on hand ÷ 30-day sales, with Weeks the same ratio × 4.34. Both are blank when stock remains but nothing sold in 30 days.
Controls differ from the other five. Columns are shown and hidden from a View options button (Show columns, with Show all columns to reset) rather than the Columns popover, and unlike the other five that choice persists across reloads. Rows per page tops out at 250, not 500. A header click toggles ascending/descending only — there's no third "off" state. Clicking a SKU opens that SKU's detail modal.
3PL customer is the one column you can't hide — 25 of the 26 toggle. It reads All customers above the table when no brand is pinned, or the brand's name when one is; the Store dropdown likewise appends the owning client to each channel only in the all-clients view.
Export CSV writes every SKU matching your filters with all 26 columns — not just the page on screen — capped at 10,000 SKUs per file, and the toast confirms how many it wrote. Missing costs, prices, dates and unavailable estimates stay blank. Narrow the customer or SKU filters for anything larger.
Kits Report
For clients that sell kits (bundles of other SKUs), this lists one row per (kit, component) pair — each kit's recipe, or bill of materials, with the quantity of each component. Three tiles count Total kits, Total components, and Distinct component SKUs. Search by kit SKU, component SKU, or name; the only filter is a Date Created range. Kit SKU stays pinned left; Component SKU, Component name, Quantity in kit, Date created, and Warehouse (x) are locked on, and Kit name and Component barcode are the extras (pin either to the left). Rows aren't clickable. A client with no kits (like the demo brand here) reads "No kit components yet."
Inventory Value
A snapshot of what on-hand stock is worth right now — quantity × SKU price, per SKU and warehouse, with client and currency. There's no date filter; it's always now.
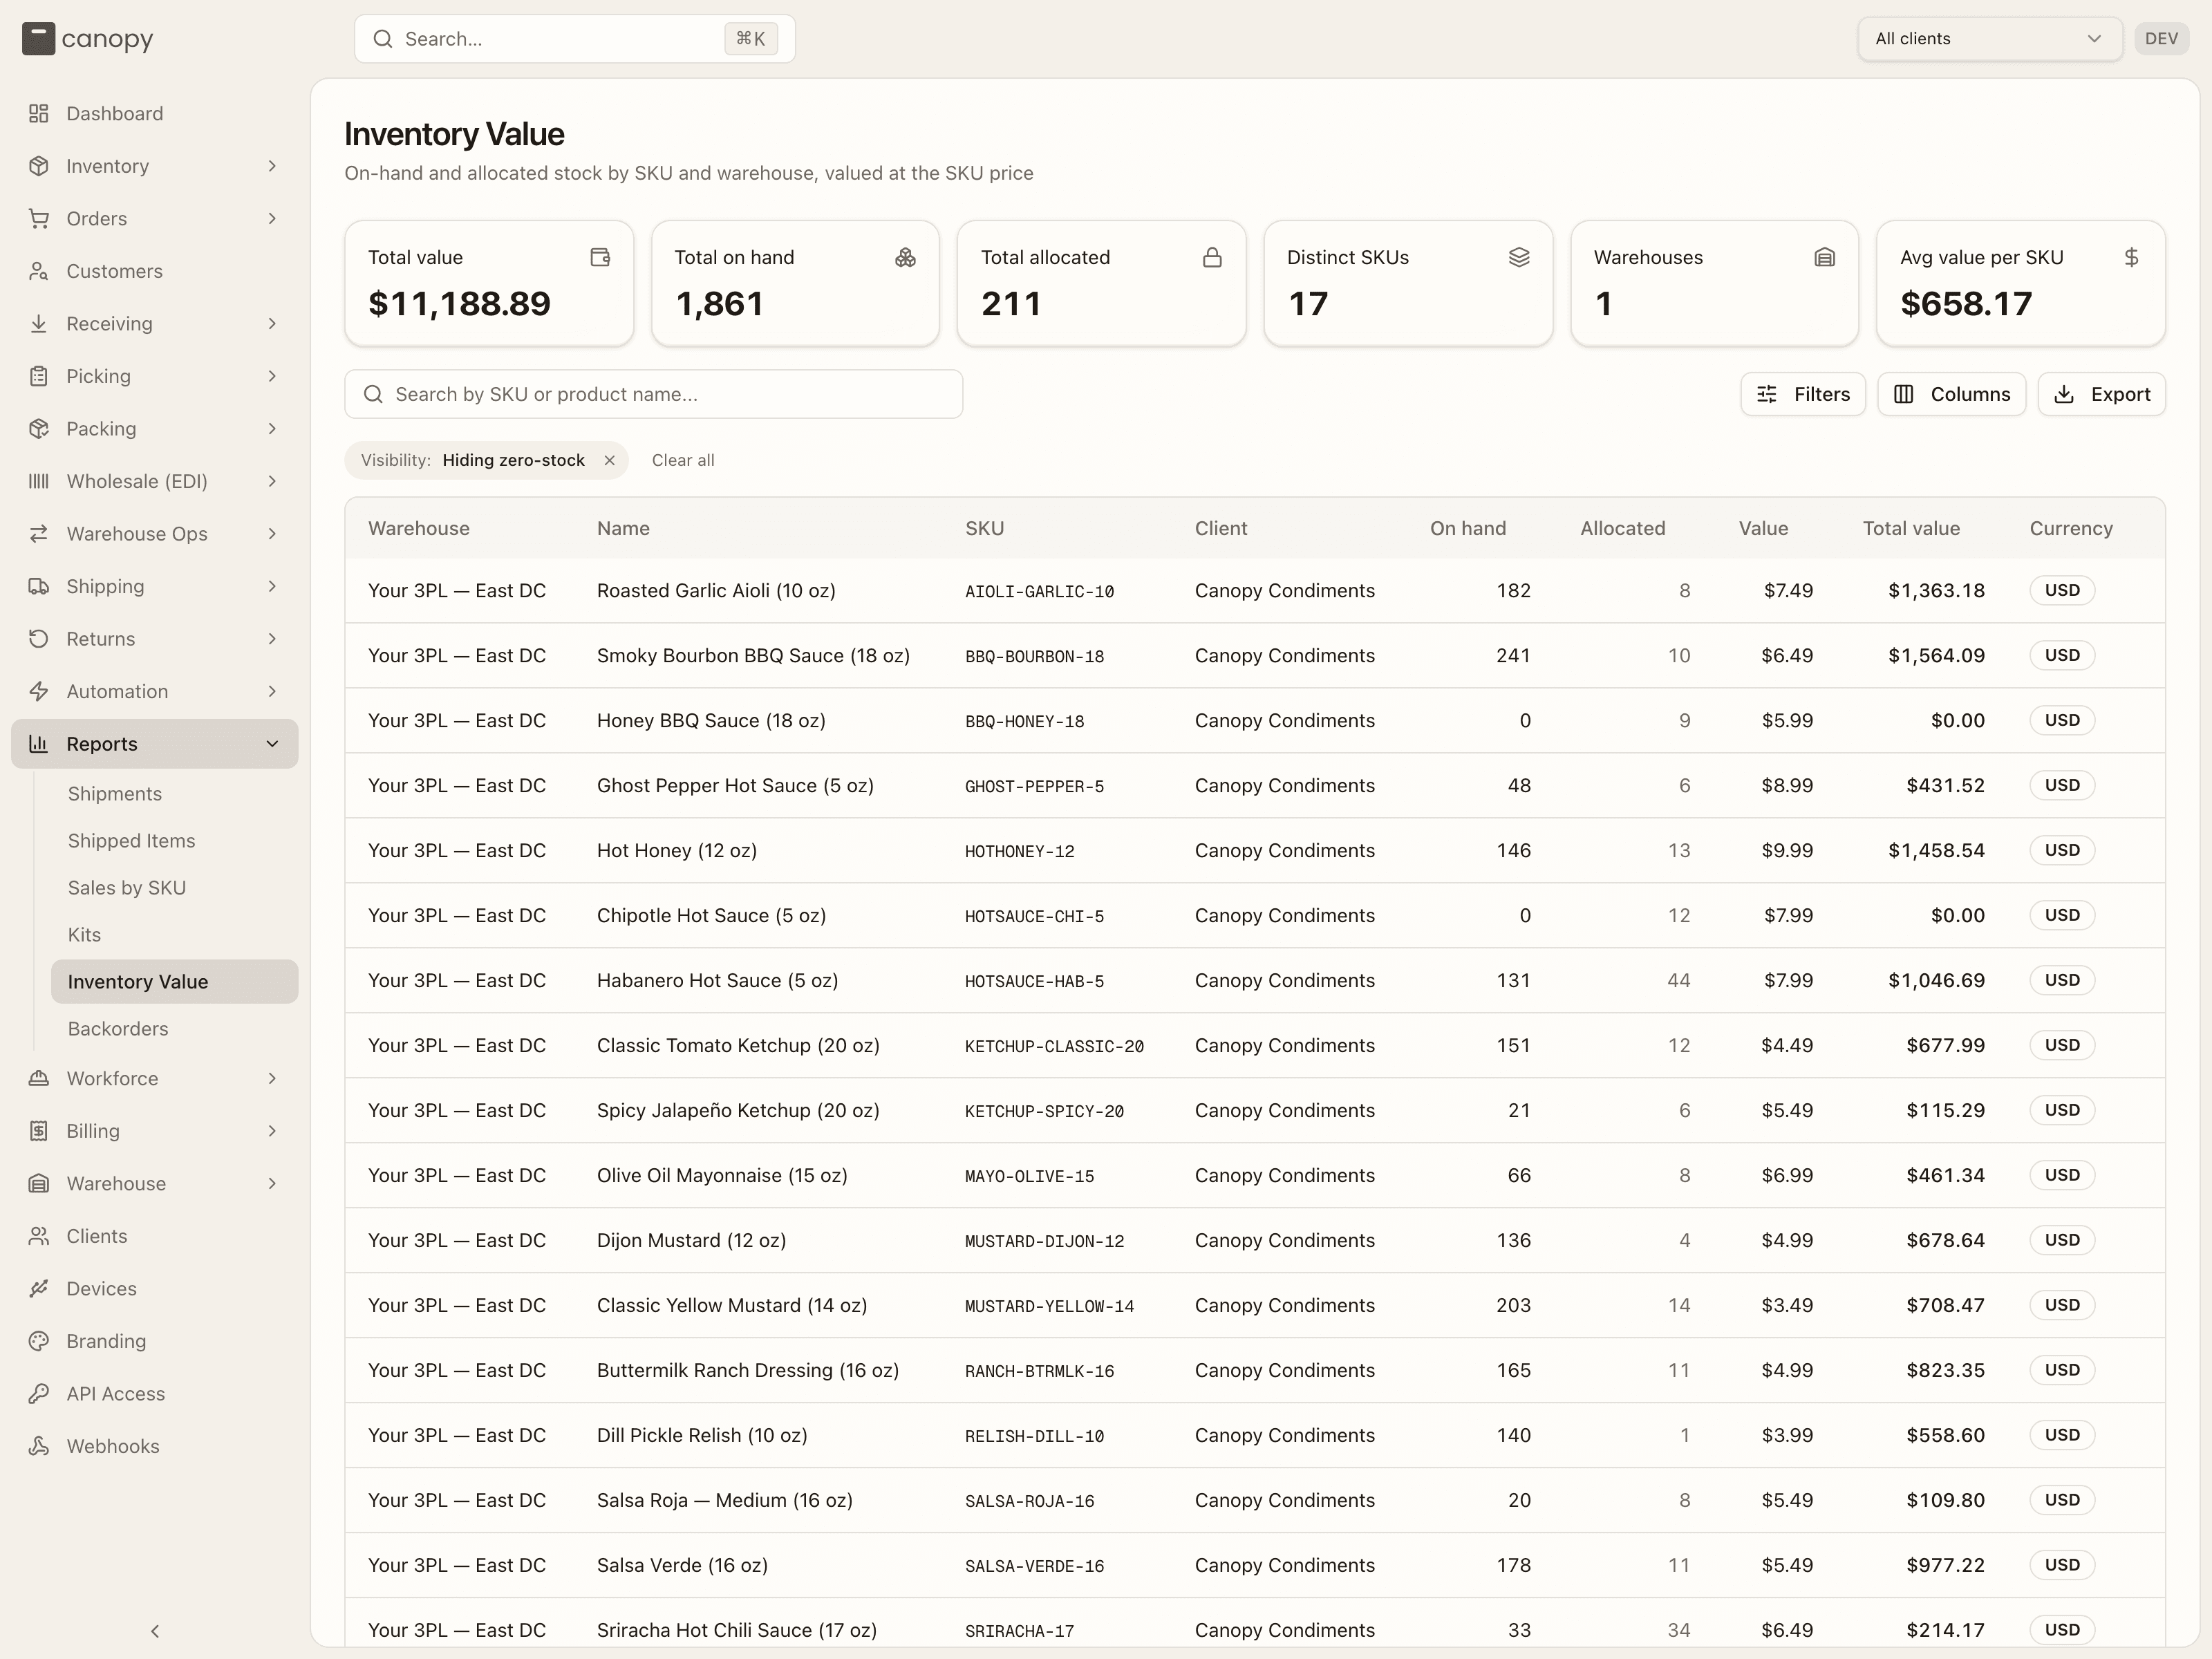
Six tiles show Total value, Total on hand, Total allocated, Distinct SKUs, Warehouses, and Avg value per SKU. SKUs with nothing on hand are hidden by default — that's the "Visibility: Hiding zero-stock" chip; tick Include zero-stock SKUs in the Filters popover to see them. Search by SKU or product name. Every column (Warehouse, Name, SKU, Client, On hand, Allocated, Value, Total value, Currency) can be hidden, and rows are read-only. The footer names the currency the totals are in.
Backorders
Which SKUs have unmet demand — what's short, which orders it's holding up, and what's already inbound — one row per SKU × warehouse where something is short. A SKU sitting at zero with nobody waiting on it isn't a backorder and doesn't appear; a SKU with stock on the shelf that's all already allocated does. Orders on hold are excluded (they're waiting on a decision, not on stock); every other open order counts, whatever its status.
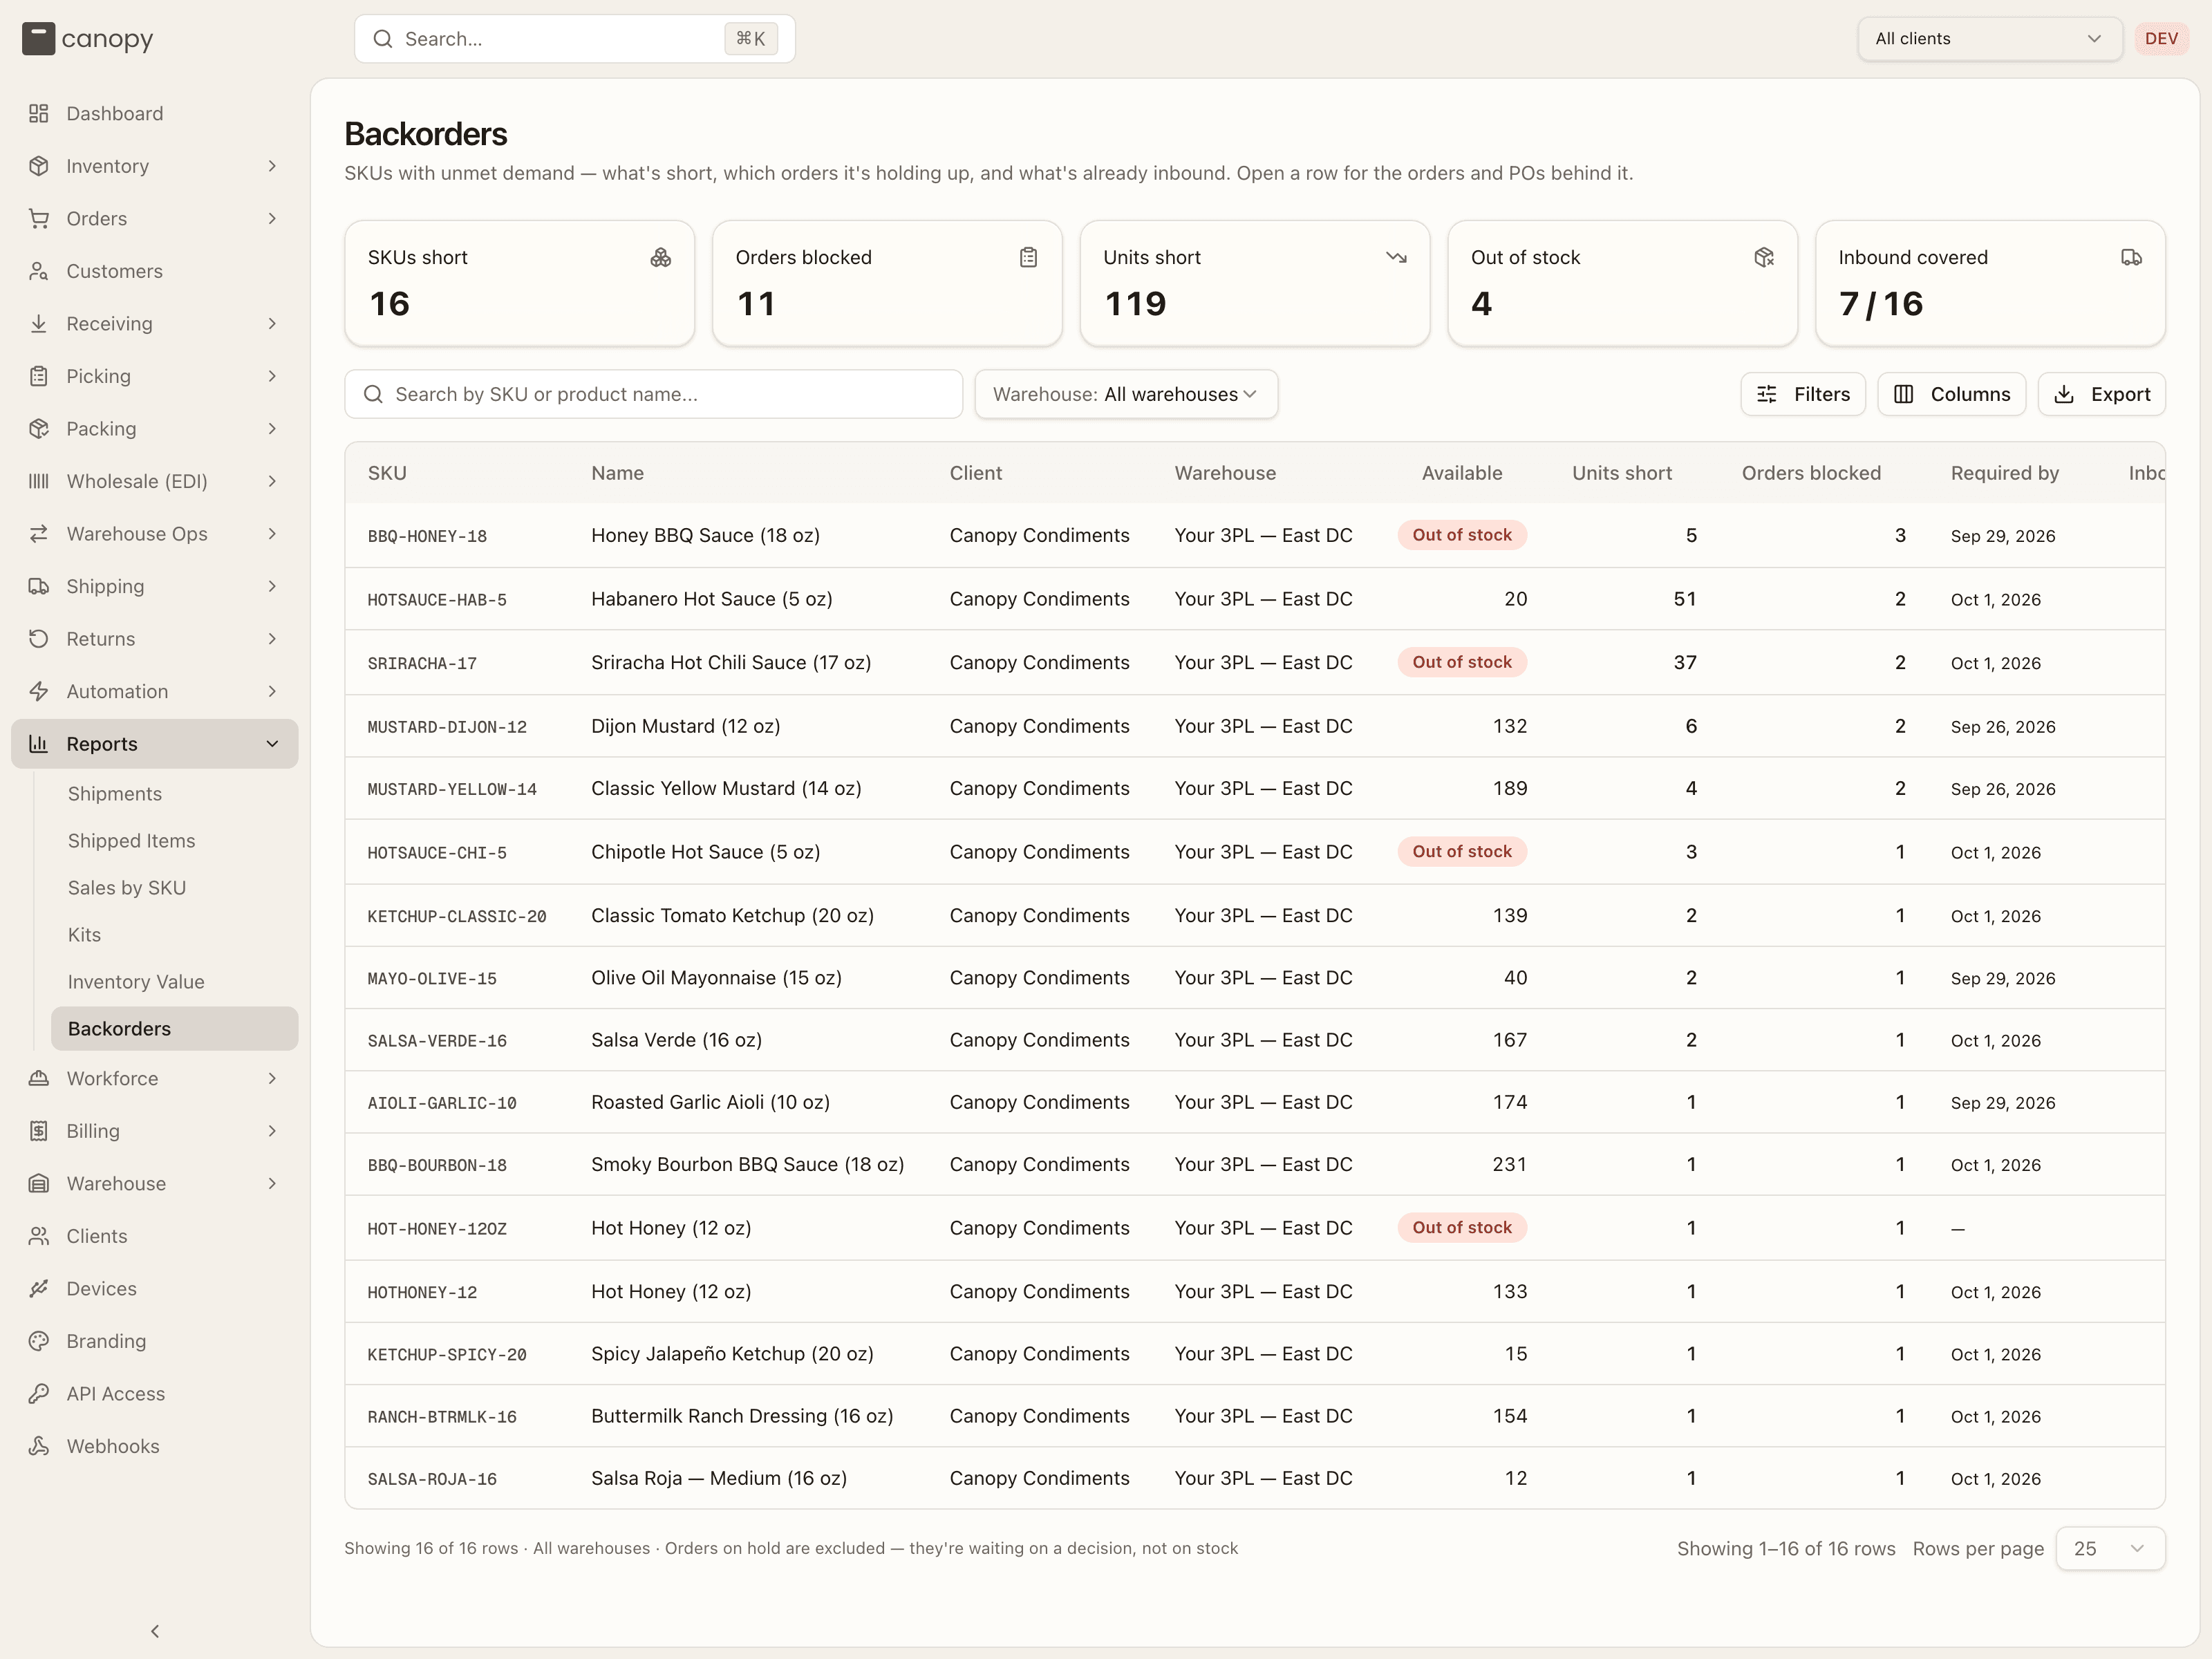
Five tiles head the page, all following the filters: SKUs short, Orders blocked, Units short, Out of stock (short SKUs with nothing left to promise), and Inbound covered (how many of the short SKUs have an open PO bringing some in, as n / SKUs short).
Filtering. Search by SKU or product name. The Warehouse select defaults to All warehouses and is the report's own — it doesn't follow the topbar warehouse switcher, because "where is this biting hardest" is a cross-warehouse question. The Filters popover holds two checkboxes:
- Out of stock only — keeps SKUs with nothing left to promise. Stock that's on hand but already allocated counts as none, and so does unsellable stock (quarantined bins; expired, held, or short-dated lots). Stock in a non-pickable reserve or overstock bin is not unsellable — the allocator can draw on it, so it counts as available.
- Not covered by a PO — drops rows an open PO already covers in full under sell ahead; what's left is the shortfall still needing a buying decision. For clients that don't sell ahead it narrows nothing.
Active filters show as chips (Warehouse, Stock, Sell ahead) with Clear all.
Columns. Shown by default: SKU (a link straight into the SKU's detail), Name, Client, Warehouse, Available (an Out of stock badge at zero, with "N on hand unsellable" beneath it when boxes are physically present but the allocator can't use them), Units short, Orders blocked, Required by (the earliest required ship date among the blocked orders), Inbound (outstanding units on open POs — green when it clears the shortfall, plain when it only dents it, "—" when nothing is coming), and Inbound ETA ("No ETA" when the PO has no expected arrival; "Nothing on the way" when there's no PO). The Columns popover adds On hand, Allocated, Unsellable, Waiting since (the oldest blocked order's date), and Covered by PO — how many of the short units the client knowingly sold against an open PO. That last one reads "—" for any client whose Sell ahead switch is off; a green number means every short unit was sold ahead deliberately. Any column can be hidden; Reset restores the defaults. Rows sort worst-first — most orders blocked, then most units short — until you click a header.
The detail sheet. Click a row to open the drill-down. The header repeats the SKU, name, and warehouse; four figures give Units short, Available, Inbound (quantity · ETA), and Covered by PO ("This client doesn't sell ahead" when that's why it's blank). Below are two tables:
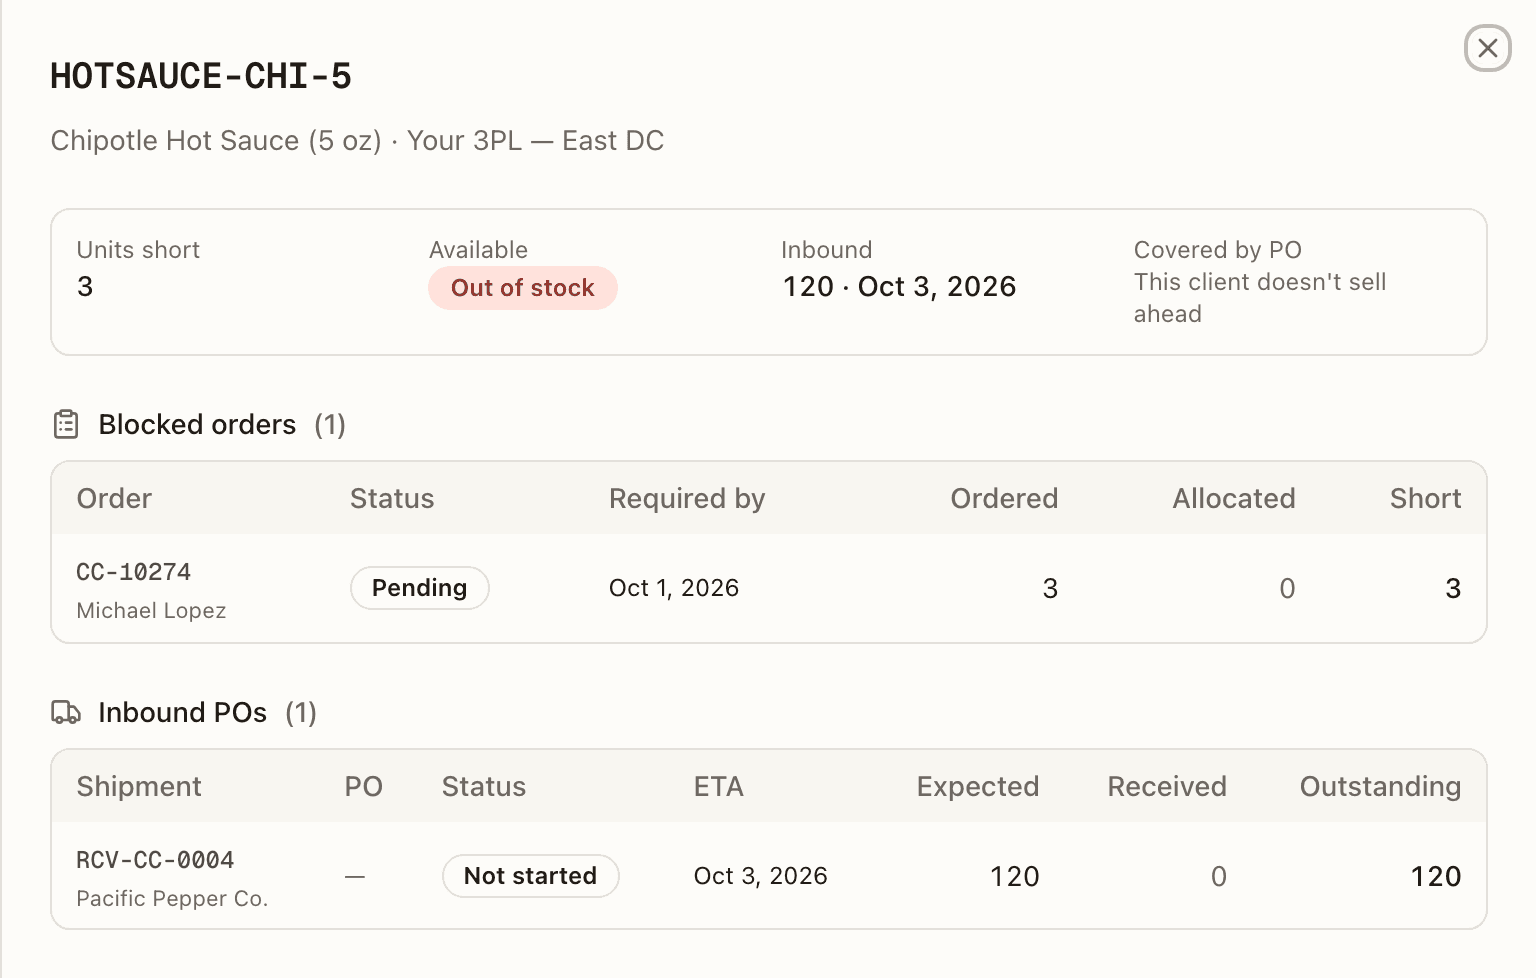
- Blocked orders — Order (a link into Manage Orders, with the customer's name beneath), Status, Required by, Ordered, Allocated, and Short. If the row has cleared since the table loaded it reads "No blocked orders."
- Inbound POs — Shipment (a link to the PO, vendor beneath), PO (the external PO number), Status (Not started or Receiving), ETA, Expected, Received, and Outstanding, with "N sold ahead" under Outstanding when part of that PO is already promised. With nothing coming it reads "Nothing on the way. Raise a PO to clear these orders."
Export. Unlike the other reports, Export pulls the whole filtered
set, every column, regardless of what's on screen — and adds one row per
blocked order and one per open PO under each SKU (a Row type column tells
them apart), because chasing orders and raising POs happens in a spreadsheet.
The toast counts the blocked-order and PO rows it wrote; a very large export is
capped and the toast says "capped; narrow the filters for the rest". The file
is named backorders-<client>-<warehouse>-<date>.csv after whatever scope is
pinned. With nothing short the table reads "Nothing is on backorder. Every open
order has its stock."
Working with the tables
The five original reports share the same controls: click any column header to sort (asc → desc → off), use the Columns popover to show/hide columns, and set the Rows per page selector (25 / 50 / 100 / 250 / 500). Shipments and Kits pin their first column and lock the essentials (you can only hide the extras, and can pin any of those to the left); Shipped Items locks its essentials too; Inventory Value and Backorders let you hide anything. Shipments and Shipped Items rows open the order; Backorders rows open the detail sheet; Kits and Inventory Value rows are read-only. Columns marked (x) always show "—" — they're placeholders for data not yet captured. Sales by SKU differs: its column control is the View options button, its Rows per page selector tops out at 250, a header click toggles ascending/descending only (there is no off state), and clicking a SKU opens the SKU detail modal.
Automation
Rules that fire automatically as orders flow through — warehouse routing, postage, holds, order lines, packing, box selection, and replenishment.
Cost to serve
What each brand cost your warehouse in labour, per order, per week and per stage, measured from task timestamps and set beside what you billed them.