

Dashboard
Your all-clients operations overview — today's pace, per-brand progress, exceptions, inventory health, SLA, and throughput.
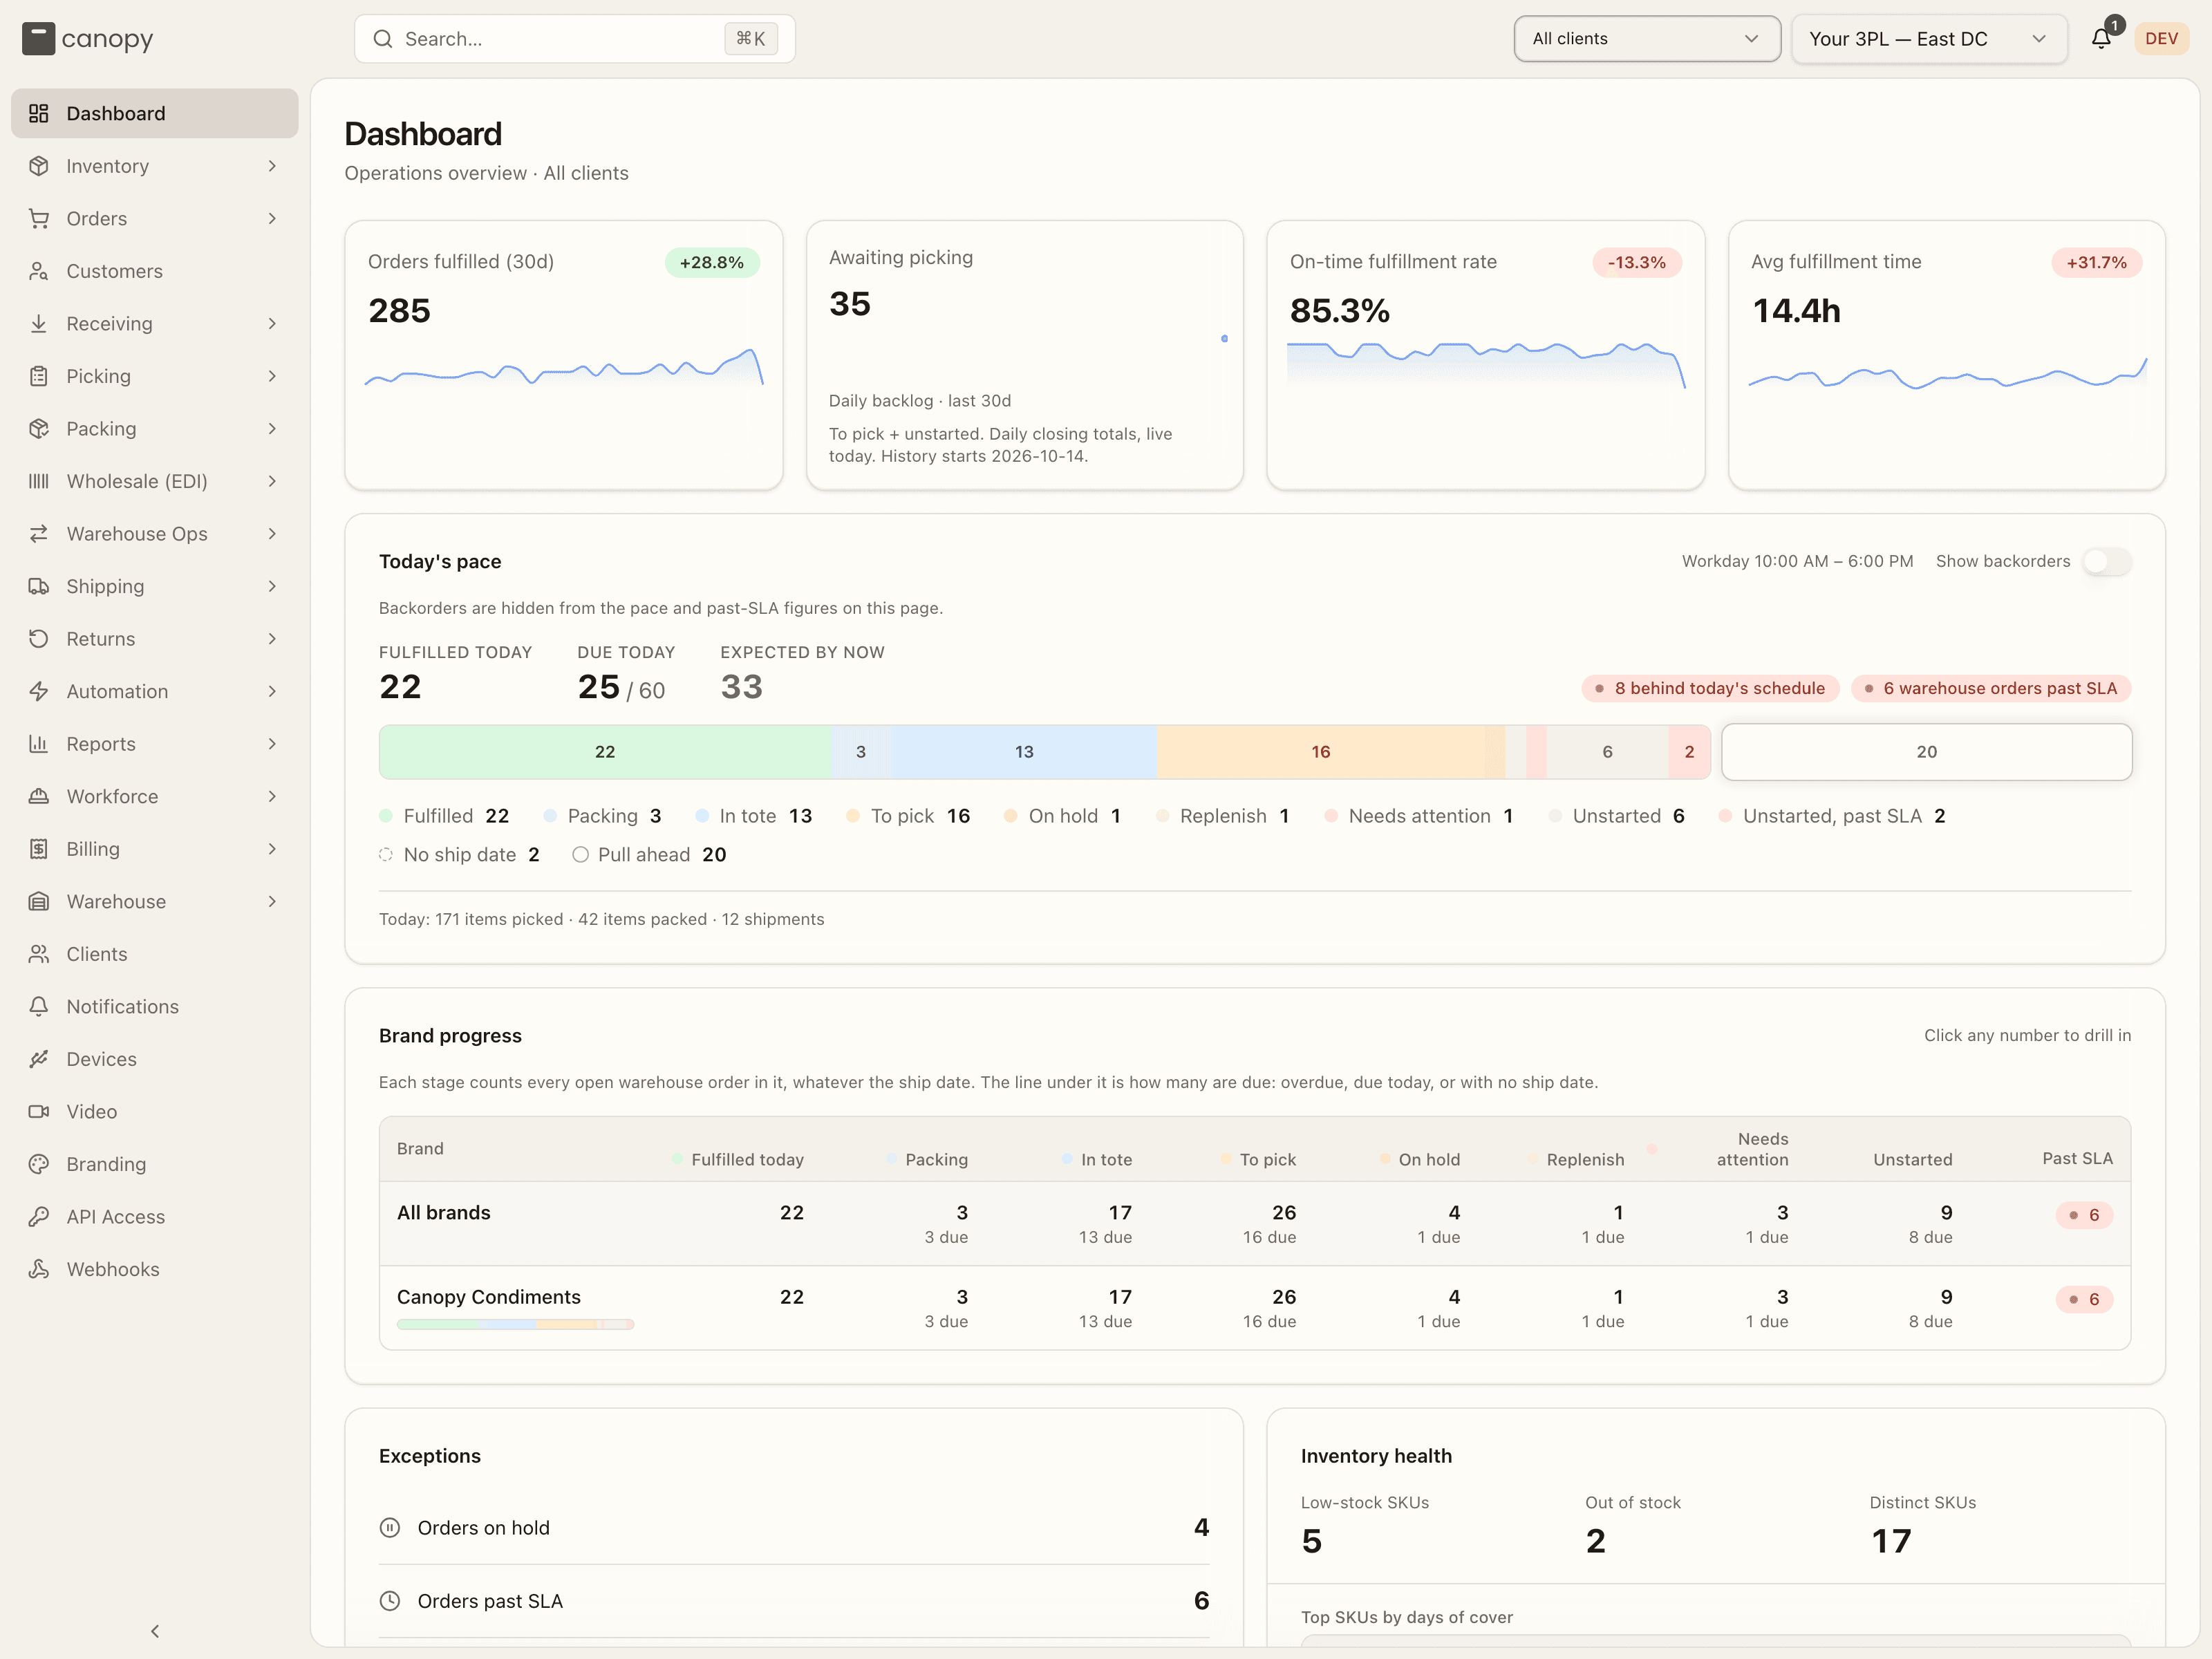
The Dashboard answers the question you care about first thing: is every client on track today? By default it aggregates all your clients; use the All clients switcher (top right) to focus on a single brand.
All clients vs. one brand
The subtitle tells you the scope — Operations overview · All clients, or · the brand name when you've pinned one. Some panels (Brand progress, the cross-client breakdowns) only appear in the all-clients view; the rest re-scope to the brand you pin.
The KPI tiles
Four headline numbers across the top, each with a sparkline. Three carry a trend badge (last 7 days vs. the 7 before). Awaiting picking shows the combined To pick + Unstarted backlog at the end of each day of the selected range (e.g. Daily backlog · last 30d under the plot), with today's live total as the latest point. History starts on the date shown below the plot. Earlier days are unavailable, not zero. The whole tile links into the queue it counts:
| Tile | What it tells you |
|---|---|
| Orders fulfilled | Orders shipped over the window (label shows the range, e.g. 30d). |
| Awaiting picking | Orders in ALLOCATED (To pick) or PENDING (Unstarted). Click the tile to open Manage Orders filtered to both statuses. Replenish, held, and backordered orders are excluded. The plot retains historical counts as orders move through fulfillment. |
| On-time fulfillment rate | Share of orders shipped within SLA. |
| Avg fulfillment time | Average received-to-packed time, in business hours (lower is better, so a downward trend is green). |
Where a number is labelled orders and no warehouse is picked, it counts the customer's order: an order split across warehouses counts once, is fulfilled on the day its last warehouse's order packs, and is past SLA when any of them is. Today's pace, Brand progress and the queues count warehouse orders instead, and say so; with a warehouse picked, every number counts that warehouse's own orders.
Packs without video
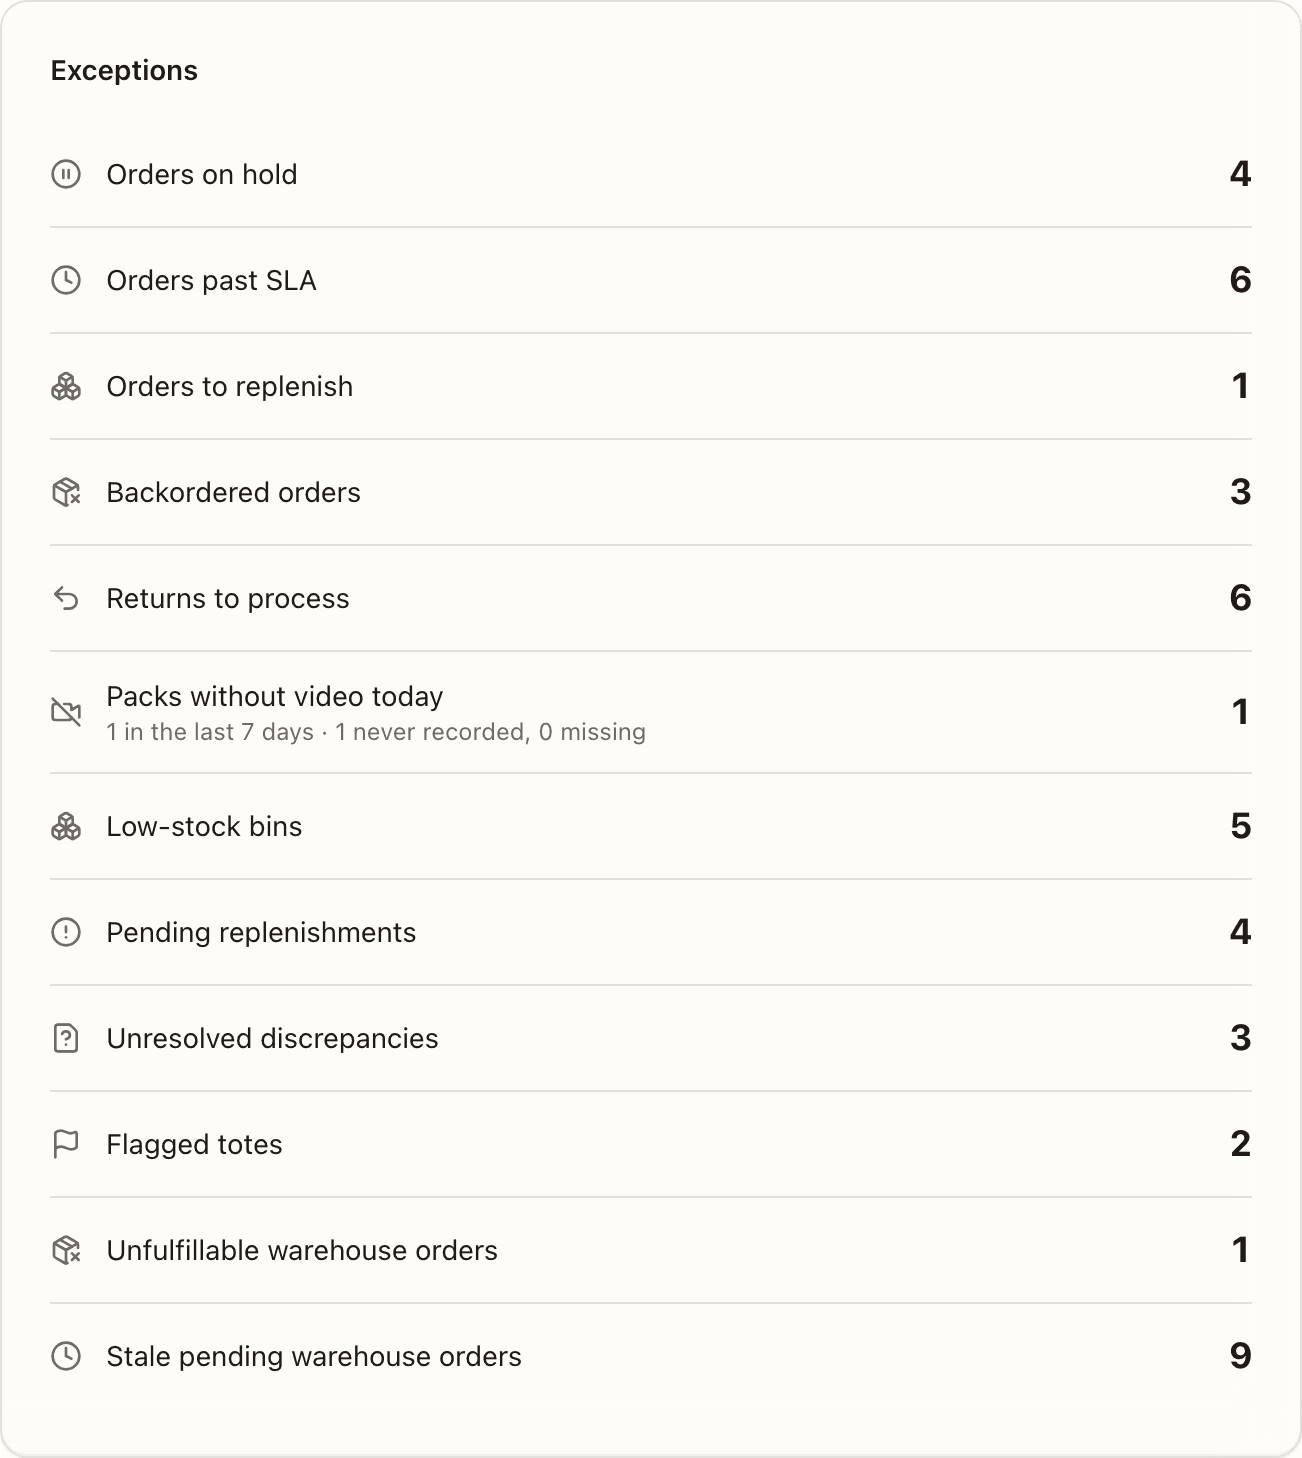
Once a camera is paired, the Exceptions panel gains a line: Packs without video today. It counts the packs completed today at the selected warehouse (every warehouse on All) that have no clip. Under it, in small text, sit the last seven days and the split between never recorded and missing. The count is bold when it is above zero. Click the line to open Pack Videos filtered to today's not-recorded packs, where each one carries its reason. The line stays even on a quiet day, so the week's count is always in view, and it does not show until a camera is paired. What the two kinds mean is on Pack video.
Today's pace
The bar covers every open order — overdue, due today, or with no ship date — not just today's cohort, so it reflects the whole floor. The target for the pace read is narrower: every order whose required ship date is today. The panel reads that against the clock: a Fulfilled today count, a Due today N / target headline, an Expected by now figure, a hard-coded 10:00 AM – 6:00 PM workday label, and a status pill that's one of N due today, workday not started, On track for today, N ahead of today's schedule, N behind today's schedule (with ~5% slack), or N due today still unshipped after hours. A red pill, N warehouse orders past SLA, flags orders already overdue; when nothing's due you'll see "Nothing due today".
The panel counts warehouse orders, the orders each warehouse works on, and its labels and tooltips say so. An order split across warehouses counts once per warehouse here.
Below the headline, the bar breaks open work into stages, each of which deep-links to Manage Orders filtered to those statuses:
| Stage | Underlying order statuses |
|---|---|
| Fulfilled | FULFILLED / SHIPPED / DELIVERED, finished today |
| Packing | PACKING |
| In tote | PICKING / PICKED |
| To pick | ALLOCATED |
| On hold | ON_HOLD |
| Replenish | REPLENISH |
| Backordered | BACKORDERED |
| Needs attention | UNFULFILLABLE / PARTIALLY_SHIPPED |
| Unstarted | PENDING — overdue ones split out in red as Unstarted, past SLA |
Replenish is the near-ready band: the order's stock is reserved, but not all of it sits in a pickable bin, so a picker would come up short. Hovering the band says so — "Replenish picking locations or use Bulk Ship" — and those are the two ways out: top the pick face up from reserve (Replenishment), or ship it straight from overstock in Bulk Ship, which batches Allocated and Replenish orders together. The Show backorders toggle does not touch this band.
Orders dated after today ride outside the solid bar as an outlined Pull ahead block: available to start early, not counted in the target. The legend under the bar repeats each stage with its count, and adds a dashed No ship date entry when any open order has no required ship date — those orders are already counted inside the stage segments (an undated order in a tote is still in a tote), so the entry is a cross-cutting tag rather than a band of its own. Click it for the list; set a ship date and they sort themselves into a deadline.
Show backorders in the panel header is off by default, so orders waiting on
stock drop out of the pace figures, the past SLA pill, the Exceptions panel's
Orders past SLA row and the Brand progress table — they're not the floor's
work. A note under the title says so: "Backorders are hidden from the pace and
past-SLA figures on this page." Turn it on to count them everywhere; the
Exceptions panel's Backordered orders row lists them regardless. The choice
lives in the page URL (?backorders=1), so it survives a refresh and a
bookmark.
When there's nothing open at all and nothing pulled ahead, the panel shows an empty state instead of a bar: "Nothing open" with backorders shown, or "No matching warehouse orders" with them hidden (turn on Show backorders to include orders waiting for stock).
Throughput footer (operator-only)
The foot of the panel shows three live productivity figures clients never see: items picked, items packed, and shipments today. Shipments counts parcels that left the building, not orders, so an order packed into two boxes adds two.
Brand progress
The operator-only, all-clients view of how each brand is tracking today — every brand's slice of the pace bar above, as a row of numbers. "Click any number to drill in," says the panel header, and that's the whole interaction.
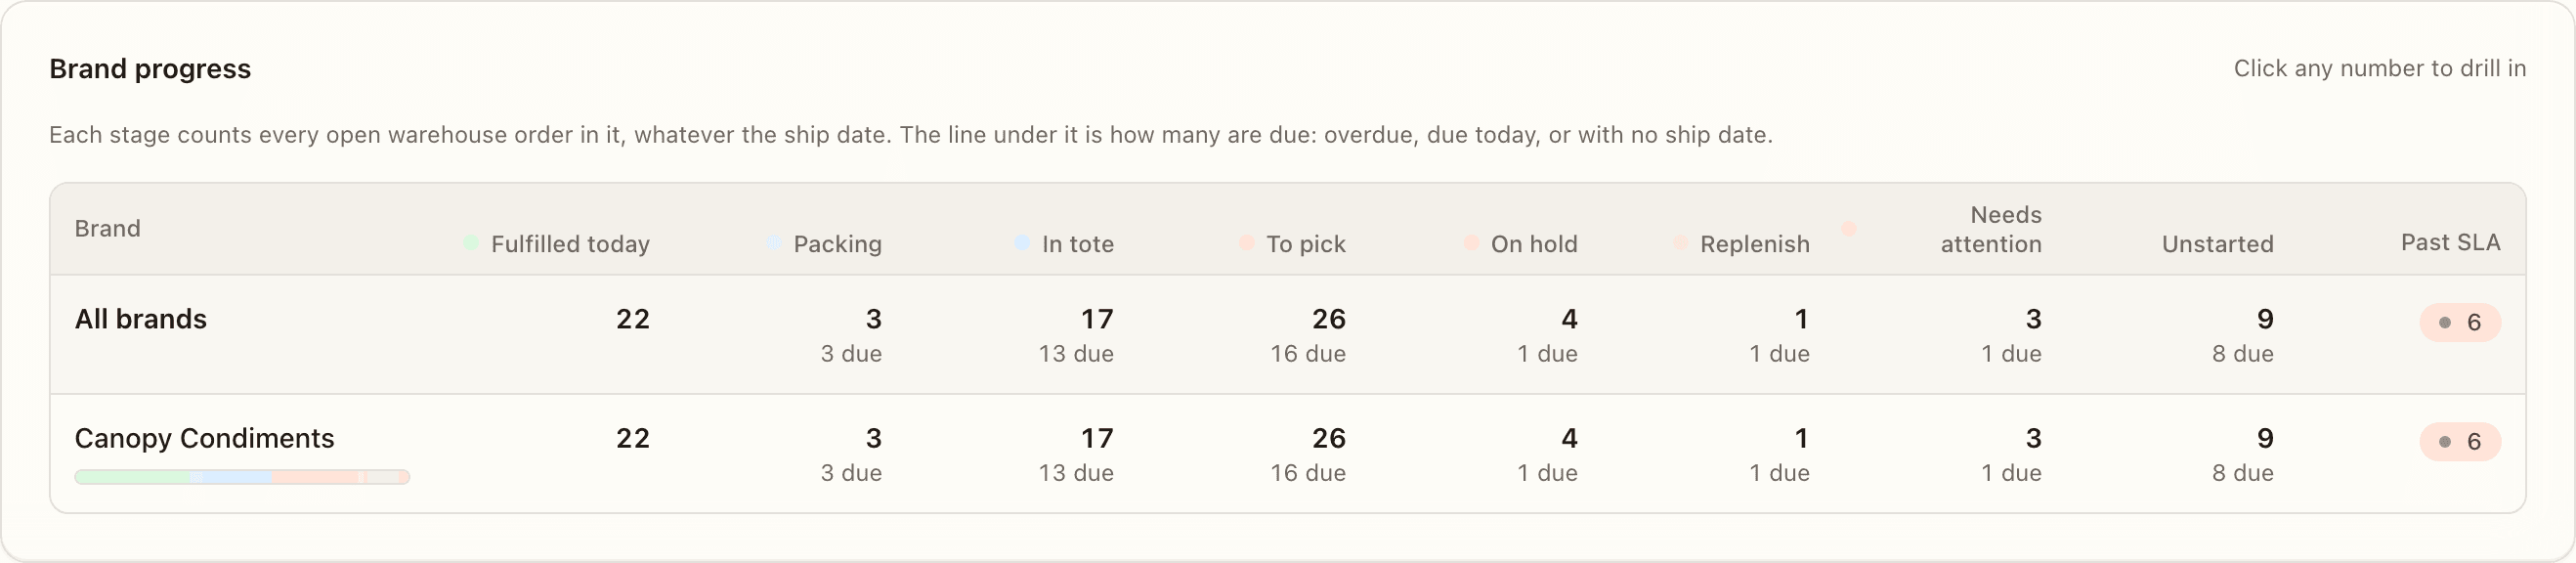
- Brand — the brand's name, with a mini pace bar underneath in the same colors as the panel above. A brand with nothing committed today reads "Nothing due — N queued ahead" instead of a bar. Click the name to pin that client in the topbar and jump to their due-today orders.
- One column per stage, in the bar's own left-to-right order: Fulfilled, Packing, In tote, To pick, On hold, Replenish, Backordered (only while Show backorders is on), Needs attention, Unstarted, Unstarted, past SLA, and Pull ahead. Each non-zero figure is a link: it pins the brand and opens Manage Orders filtered to exactly that stage; a zero is just a muted 0.
- Past SLA — a red pill counting the brand's open orders past their required ship date, at any stage. Click it for their late orders.
With Show backorders off, each brand's figures and its past-SLA pill exclude backorders too, so the table always adds up to the panel. The service returns at most the 10 brands with the most committed work; when the table is full a footer says any others aren't counted in these columns, so they may total less than Today's pace above. The whole panel reads No brand activity, "No open warehouse orders across brands, and nothing fulfilled today," only when no brand has an open order at all, pull-ahead included, and nothing was fulfilled today. The note under the panel's title says what the table counts: "Each stage counts every open warehouse order in it, whatever the ship date. The line under it is how many are due: overdue, due today, or with no ship date."
Exceptions
Your core to-do list — each row links straight to the filtered list. Brands see only the first five; operators also get the warehouse-floor rows underneath:
| Exception | What it means | Audience |
|---|---|---|
| Orders on hold | Orders paused (payment, address verification, etc.). | All |
| Orders past SLA | Open orders whose required ship date has passed. | All |
| Orders to replenish | Orders in REPLENISH — stock is reserved but not yet in a pickable bin. Not to be confused with the Pending replenishments row below, which counts replenishment tasks. | All |
| Backordered orders | Orders waiting on stock that ran out. | All |
| Returns to process | RMAs that still need action — anything not yet Completed or Cancelled, from Pending (not yet on its way back) through In Transit, Received, and Inspecting. | All |
| Low-stock bins | Pick faces below their replenishment threshold → Replenishment. | Operator |
| Pending replenishments | Replenishment tasks waiting to be run. | Operator |
| Unresolved discrepancies | Stock counts that don't match → Discrepancies. | Operator |
| Flagged totes | Totes needing attention → Totes. | Operator |
| Unfulfillable warehouse orders | Orders in UNFULFILLABLE, waiting on manual review — nothing automated retries them, so this row is how they get eyes. | Operator |
| Stale pending warehouse orders | Orders still PENDING more than 30 minutes after creation. Orders auto-allocate at import, so one stuck here has fallen through and needs a manual Allocate. | Operator |
When every count is zero the panel reads "No active exceptions". With no warehouse picked, Orders past SLA counts customer orders, so on an order split across warehouses it can differ from the past-SLA pill in Today's pace, which counts warehouse orders.
Inventory health
A fast read on what's running low by days of cover (how long stock lasts at recent sales velocity), across all clients — with a Client column so you know whose SKU it is (it drops out when you pin a brand). Counters up top: Low-stock SKUs (under 14 days), Out of stock, Distinct SKUs.
The table below is headed Top SKUs by days of cover and ranks the low-stock SKUs least-runway first. When nothing is low, it switches to Lowest days of cover with the note "All SKUs are healthy — these have the least runway at current velocity" — a watch-list rather than an empty state. Each row shows the SKU (a link to the SKU), On hand summed across every bin, Bins holding it (a link to Item Locations filtered to that SKU; a dash when it's in none), and a color-coded Cover pill:
| Color | Days of cover |
|---|---|
| 🔴 Red | under 7 — reorder now (<1d when there's less than a day) |
| 🟡 Amber | 7 to under 14 — reorder soon |
| 🟢 Green | 14+ — healthy |
A dash (—) means stock but no recent sales, so there's no velocity to project from. Velocity follows a SKU merge: units that shipped on a SKU since merged into another count toward the SKU it was merged into, and the retired SKU itself never appears in the list. Days of cover counts only sellable stock — expired, short-dated, on-hold, and recalled lots are excluded. If no SKU has shipped in the selected window there's nothing to rank, and the panel reads "No velocity yet".
SLA Performance
The distribution behind the on-time tile: On-time rate, Median ship time, and P90 ship time (defined in the glossary), plus a ship-time histogram bucketed 0–12h / 12–24h / 24–48h / 48h+. All of these are measured in business hours (created → packed) against each client's Target — shown as a Business hours badge (with · Mixed when warehouses' hours differ) and a Target: Xh badge. The Recent breaches list below is orders that shipped late — a different set from the Exceptions panel's Orders past SLA (which are still open and overdue), so the two counts won't reconcile.
The 7 / 30 / 90 range control lives here
The range selector sits in this panel's header, not on the bottom chart. Changing it re-runs the whole dashboard (KPI tiles, SLA panel, and trend chart), defaults to 30 days, and is saved in the URL so you can bookmark a view.
Inbound this week
A quick inbound read — Expected today (POs arriving today), Pending shipments (open POs not yet started), and In progress (POs being received). Manage them in Receiving.
Fulfilled over time
The chart at the bottom plots orders fulfilled (packed) per day across the selected range, so you can spot weekly rhythm and growth. Note "fulfilled" throughout the dashboard keys on when an order was packed, not when the carrier scanned it.
Returns
Create and process RMAs end to end — receive, inspect, disposition, and refund — plus the reason codes customers pick from.
Notifications
The bell, the feed, and the subscriptions behind them — how warehouse staff get told that an order went on hold, a PO came in short, or a parcel stopped moving.